Dashboards that turn risk into clarity.
From data models to dashboards, we turn your risk data into insight. Get powerful visualizations that help you see what matters, and act on it. Tailored for Riskrunner, Bowtie Master, and BowtieXP Enterprise.
From words to visuals
One dashboard for all your risks.
See your risk data come to life with interactive dashboards that transform complex information into clear, actionable insights for better decision-making.
From complexity to control
Everything you need to visualise your risks.
We understand the common user stories that organisations need answers to and we've translated them into clear PowerBI semantic models. These dashboards help visualise your risks and support effective management and mitigation.
Hazard insights
Identify where poor barrier performance puts your risks at stake. As a hazard owner, you need to know which hazards are most at risk due to underperforming barriers. The dashboard gives you an at-a-glance overview of the bowties you're responsible for, highlighting areas that need attention.
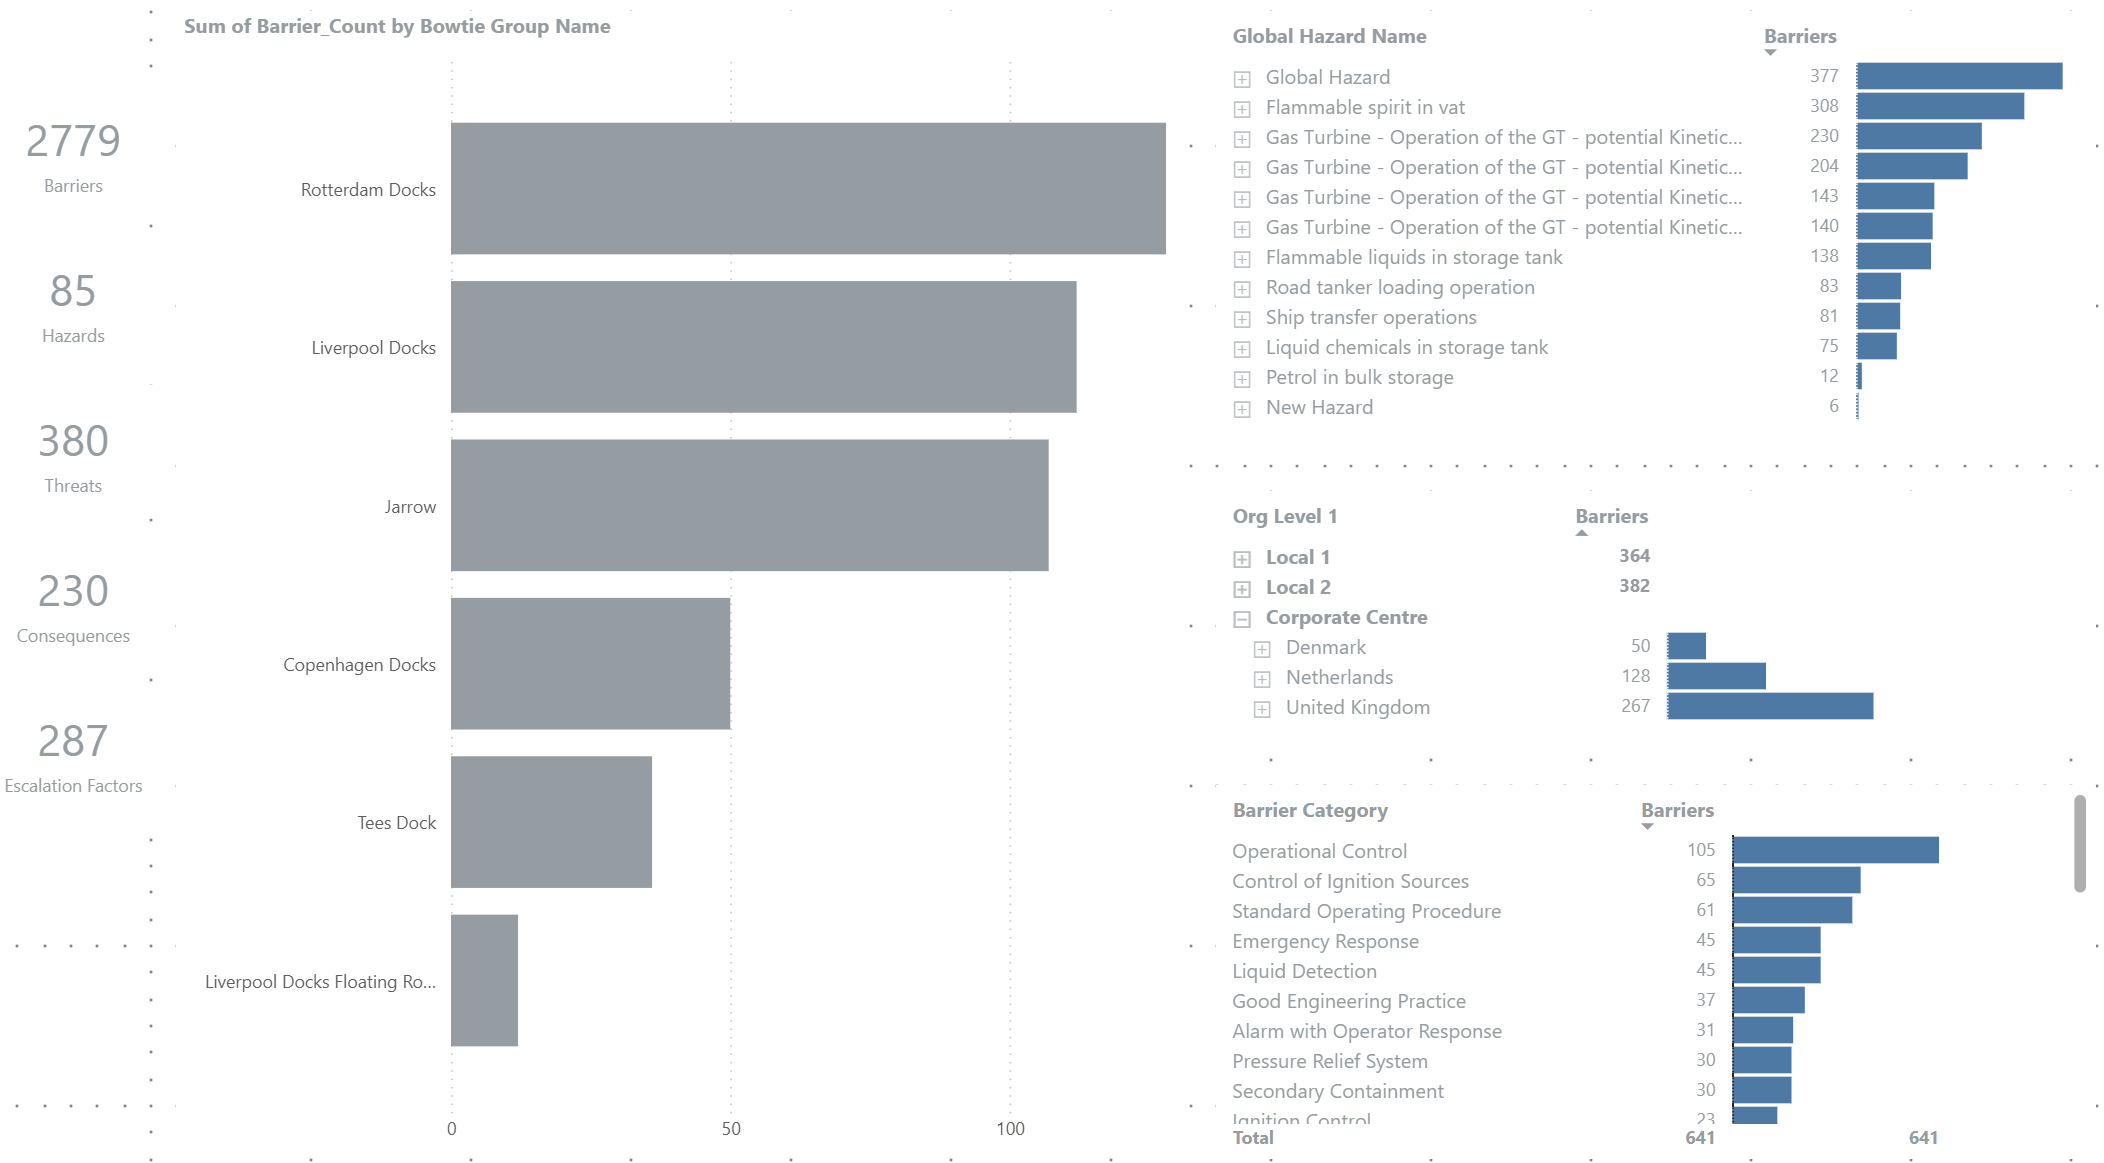
From expected versus actual barrier performance to quick filtering by risk status, it helps you commit resources where it matters most.
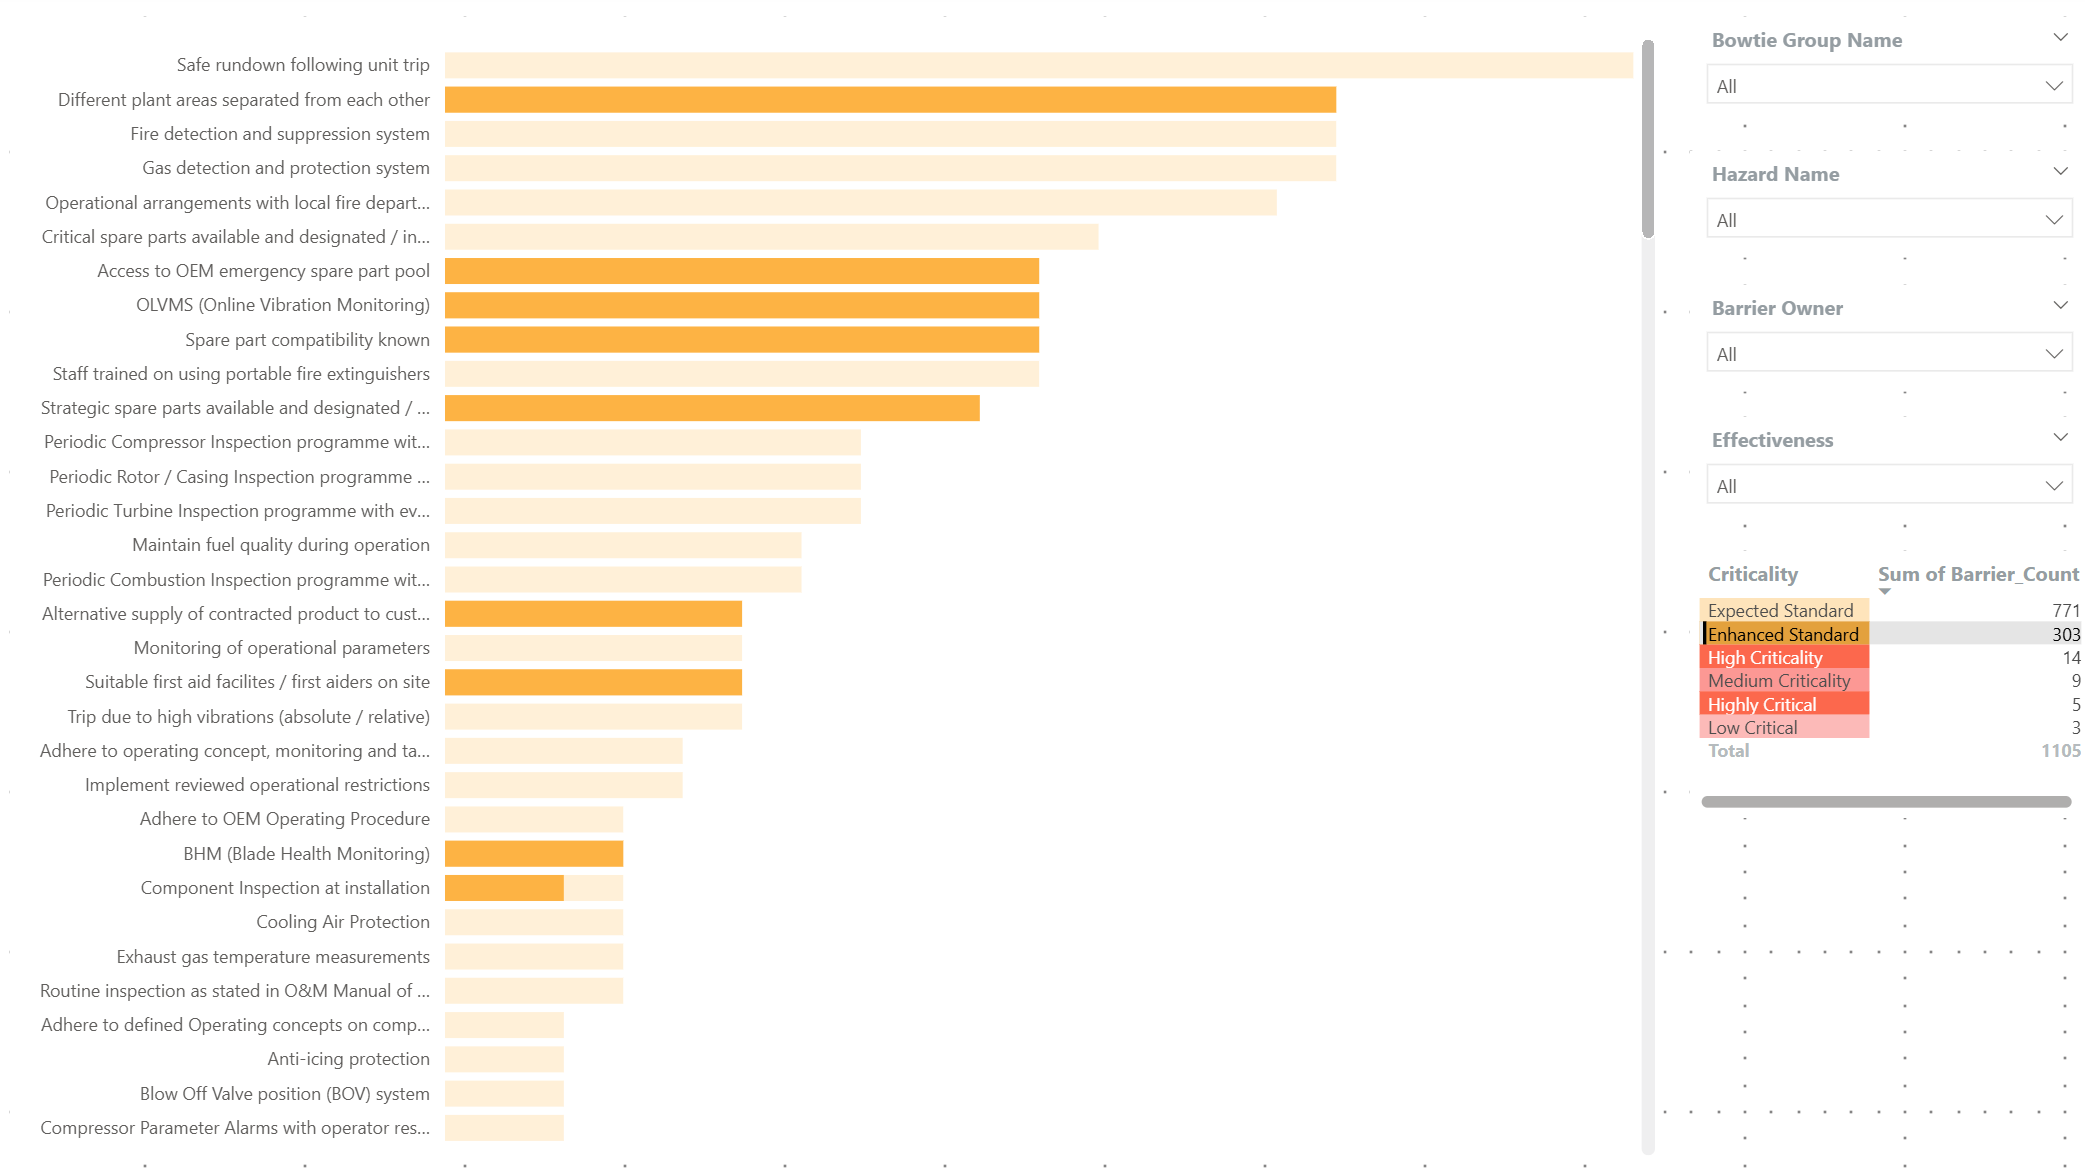
Barriers insights
Uncover weak spots in your barrier portfolio, before they turn into incidents. Barrier owners are accountable for making sure barriers actually work when it counts. This dashboard shows which barriers you own, how they’ve performed over time, and where actual effectiveness falls short of expectation.
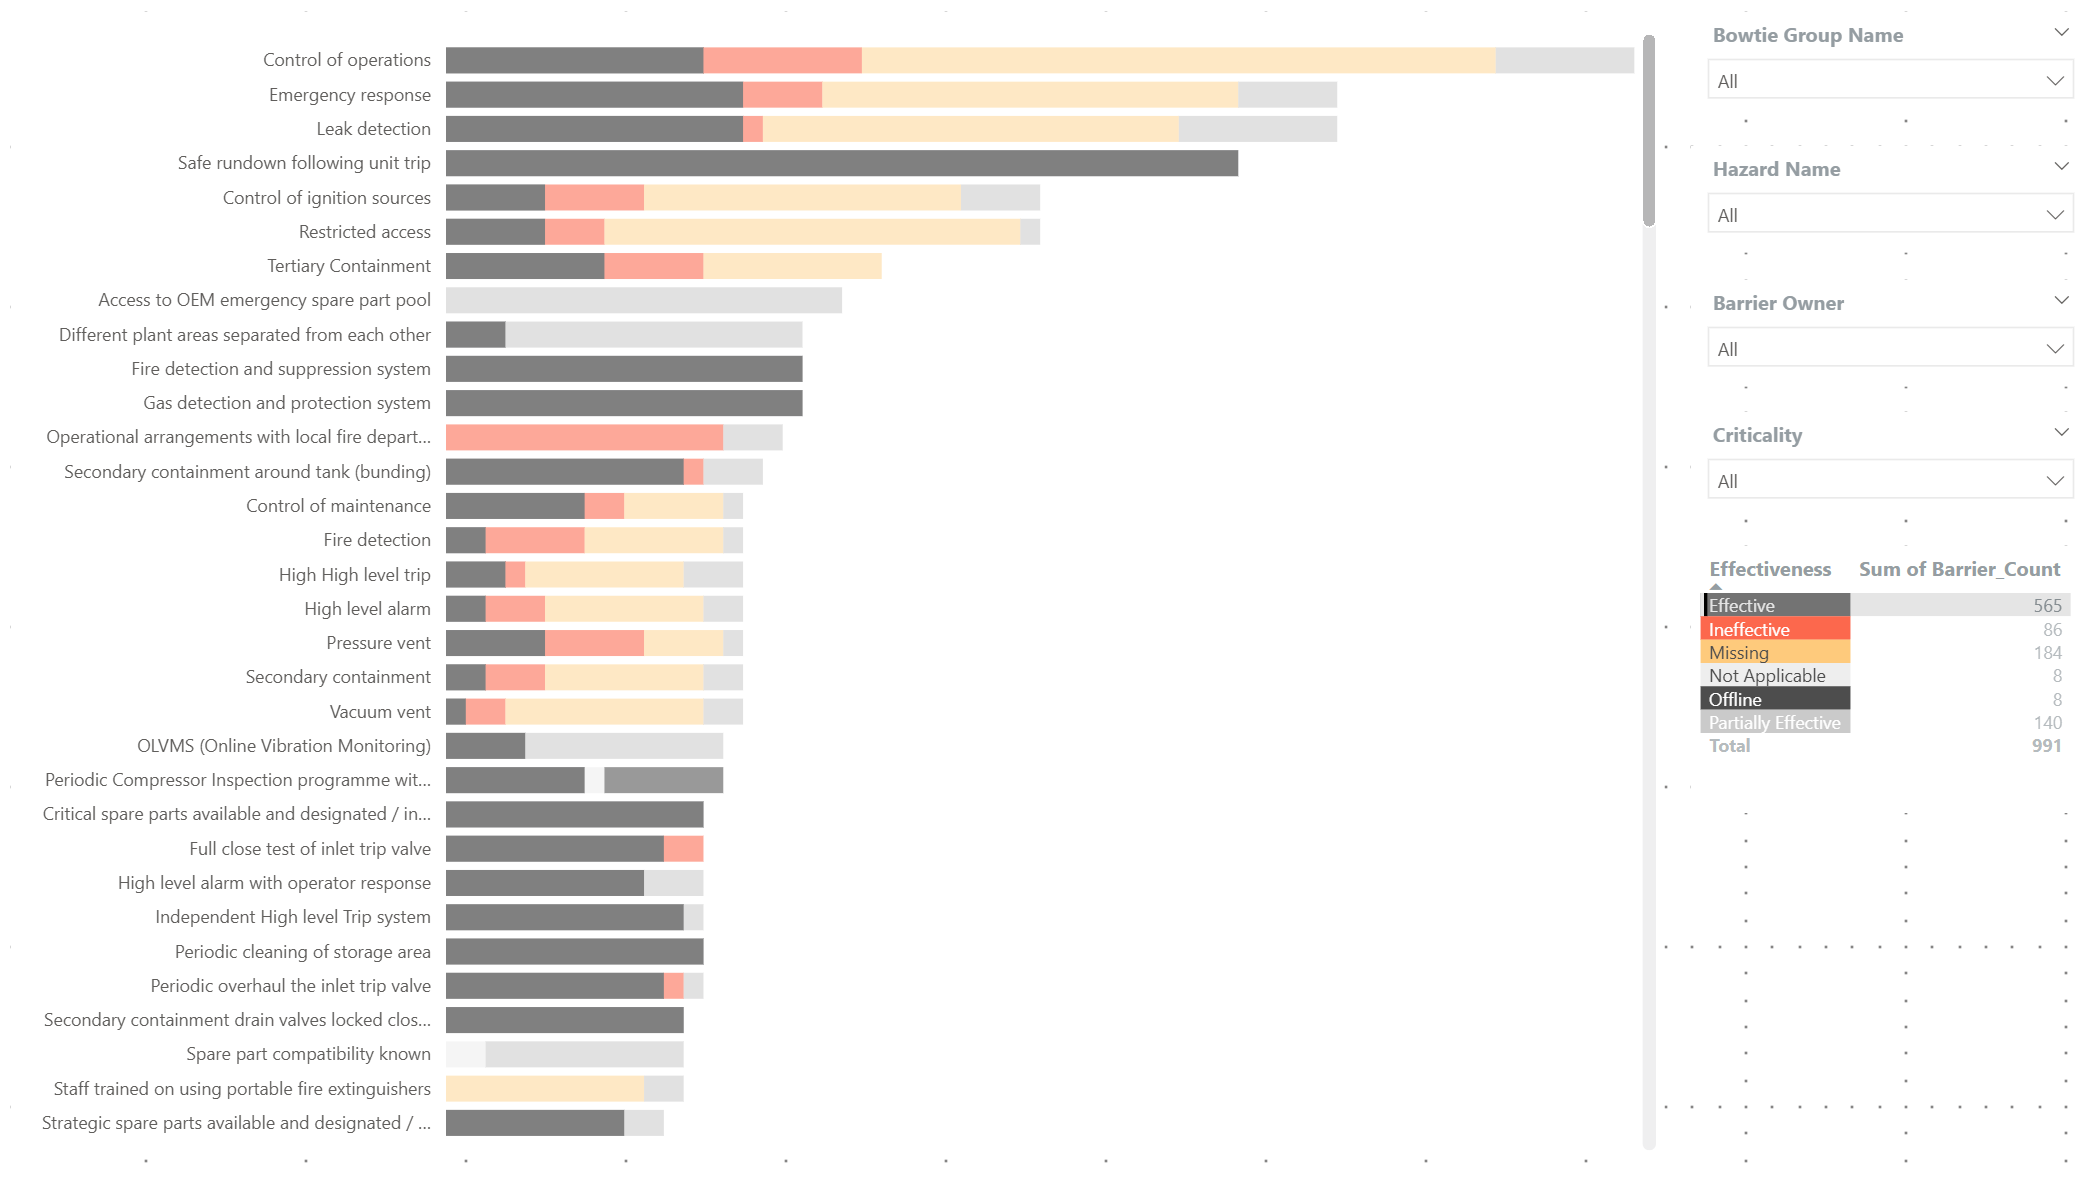
From minor gaps to major failures, you’ll know exactly where to focus your improvement efforts.
Pricing
Power up your business intelligence
Data transformation isn't easy, let us do the hard work for you. From an off-the-shelf data model to bespoke dashboards.
Off-the-shelf semantic data model for your needs
£6,000
Data model maintenance included for 2 years
Get startedTailored data model from source through transformation to published output.
- Ready for your own visualisations based on our defined user stories
- Understanding of all three platforms (Riskrunner, Bowtie Master, BowtieXP Enterprise)
- Takes the hard work out of dashboarding
- Data model updates as software releases new versions
Core risk dashboards with semantic data model
£10,000
Core dashboards and model with setup support
Get startedUser stories turned into core dashboards, plug and play with your risk data.
- Dashboards designed for leaders, managers, investigators
- Dashboards for hazard owners and barrier owners
- Quality assurance dashboard for data improvement
- Data model updates as software releases new versions
- All off-the-shelf semantic data model features
Bespoke risk dashboard with custom semantic data model
Custom
Bespoke solutions require bespoke prices
Get startedBespoke risk dashboard and data model development with data from other sources beyond the core platforms.
- Enhanced barrier health monitoring capabilities
- Data integration from sources beyond core platforms
- Trained, accredited data and risk modelling consultants
- Custom solutions for specific requirements
- All core risk dashboards features
- Dedicated consultation and support
Off-the-shelf semantic data model for your needs
Core risk dashboards with semantic data model
Bespoke risk dashboard with custom semantic data model
£6,000
£10,000
Custom
Data model maintenance included for 2 years
Core dashboards and model with setup support
Bespoke solutions require bespoke prices
Tailored data model from source through transformation to published output.
- Ready for your own visualisations based on our defined user stories
- Understanding of all three platforms (Riskrunner, Bowtie Master, BowtieXP Enterprise)
- Takes the hard work out of dashboarding
- Data model updates as software releases new versions
User stories turned into core dashboards, plug and play with your risk data.
- Dashboards designed for leaders, managers, investigators
- Dashboards for hazard owners and barrier owners
- Quality assurance dashboard for data improvement
- Data model updates as software releases new versions
- All off-the-shelf semantic data model features
Bespoke risk dashboard and data model development with data from other sources beyond the core platforms.
- Enhanced barrier health monitoring capabilities
- Data integration from sources beyond core platforms
- Trained, accredited data and risk modelling consultants
- Custom solutions for specific requirements
- All core risk dashboards features
- Dedicated consultation and support
Contact
Let's talk about your data modelling and visualisation needs.
We’re not just data analysts, we’re also risk experts who understand what organisations need to help manage their risks. Whether you have questions or need more information about our risk dashboard and data model solutions, our team is here to help.
- Telephone
- +31 712340 555
- [email protected]